

0. Overview: from a query to a cited cohort#
spatialdata-db is a catalog of public spatial omics datasets, each converted to a SpatialData store. The Python client reads the catalog, selects datasets, loads them, and records what you used so that you and others can load the same data again and cite where it came from.
The overview runs the whole path once, on three small Visium sections of human pancreatic tumours: find datasets,
build a cohort, load one dataset, join the tables into one AnnData, freeze a manifest and write the citations.
Each of the other tutorials covers one part of it in depth, with the mistakes we have seen people make.
Install#
The client is not on PyPI yet, so install it from GitHub. The viz extra adds the plotting packages that the
tutorials use.
pip install "spatialdata-db[viz] @ git+https://github.com/theislab/spatialdata-db-client@v0.1.3"
The tutorials download about 50 MB of data in total, into the cache described in 2. Load and inspect a dataset. Tutorial 1 also has two cells that download the gene index (about 900 MB) and need a lot of memory.
The recipe#
step |
what it is for |
tutorial |
|---|---|---|
|
open one fixed release of the catalog |
|
|
find datasets by facet, range, free text or gene |
|
|
build the set of datasets you want |
|
|
check the selection before you download |
|
|
look inside one dataset and load it |
|
|
one table across datasets, with matching gene ids |
|
|
record the exact datasets and check them later |
|
|
cite the studies behind the data |
import tempfile
from pathlib import Path

import matplotlib.pyplot as plt
import numpy as np
import spatialdata_plot  # noqa: F401  (adds the .pl accessor to SpatialData)
from matplotlib.colors import Normalize

import sddb

work = Path(tempfile.mkdtemp())  # the files this page writes go here
A fixed catalog release#
Every tutorial opens the catalog with sddb.Catalog(version="2026-10-28"). The catalog is published as a dated
file with every release, and the version picks that file. Without version, Catalog() reads catalog-latest,
which changes with each release: datasets get new versions and new uids, some are withdrawn and others are added.
Pinning the release makes every count and uid on the tutorial pages match what you get when you run them. In your own
work, pin the release for the same reason, and record it with your results. 3. Cohorts and manifests
counts how much changed between two releases.
cat = sddb.Catalog(version="2026-10-28")
cat
<Catalog: 6087 datasets>
Find datasets#
query filters on exact facet values. Here, Visium sections of human pancreas:
pancreas = cat.query(organism="human", technology="Visium", tissue="pancreas")
print(pancreas)
pancreas.groupby("disease")
<SpatialDataCohort: 189 datasets>
| disease | n | |
|---|---|---|
| 0 | pancreatic ductal adenocarcinoma | 158 |
| 1 | type 1 diabetes mellitus | 8 |
| 2 | exocrine pancreatic carcinoma | 7 |
| 3 | unknown | 7 |
| 4 | normal | 5 |
| 5 | pancreatic adenocarcinoma | 4 |
Build a cohort#
A query result is already a cohort, and you can narrow it further. Here we keep the stores under 10 MB, so the page runs fast, and check the summary and the licenses before anything is downloaded.
cohort = pancreas.where(pancreas.members["size_bytes"] < 10e6)
print(cohort.summary())
print(cohort.licenses())
cohort.to_df()[["uid", "disease", "n_obs", "size_bytes", "collections"]]
{'n_objects': 3, 'n_studies': 3, 'n_without_study_id': 0, 'technologies': ['Visium']}
           license  n
0  ncbi-geo-policy  3
| uid | disease | n_obs | size_bytes | collections | |
|---|---|---|---|---|---|
| 0 | qEP9pd4LlyKeufe20000 | pancreatic ductal adenocarcinoma | 1142 | 2577782 | [geo-gse294669] |
| 1 | Mc06lamGrOTYHhNF0000 | pancreatic ductal adenocarcinoma | 419 | 9362131 | [geo-gse274557] |
| 2 | URKDREjVhAsRwwF10000 | pancreatic ductal adenocarcinoma | 660 | 6079639 | [geo-gse274557] |
Load one dataset#
elements() lists what a store holds without downloading it, and to_sdata() downloads it into the cache once
and opens it as SpatialData.
smallest = min(cohort, key=lambda ds: ds.size_bytes)
print(list(smallest.elements()))
sdata = smallest.to_sdata()
sdata
['images/GSM8915497_PDAC04_hires_image', 'images/GSM8915497_PDAC04_lowres_image', 'shapes/GSM8915497_PDAC04', 'tables/table']
SpatialData object, with associated Zarr store: /tmp/sddb-docs-cache/stores/qEP9pd4LlyKeufe20000.zarr
├── Images
│     ├── 'GSM8915497_PDAC04_hires_image': DataArray[cyx] (3, 1215, 2000)
│     └── 'GSM8915497_PDAC04_lowres_image': DataArray[cyx] (3, 365, 600)
├── Shapes
│     └── 'GSM8915497_PDAC04': GeoDataFrame shape: (1142, 2) (2D shapes)
└── Tables
      └── 'table': AnnData (1142, 17943)
with coordinate systems:
    ▸ 'GSM8915497_PDAC04', with elements:
        GSM8915497_PDAC04_hires_image (Images), GSM8915497_PDAC04_lowres_image (Images), GSM8915497_PDAC04 (Shapes)
    ▸ 'GSM8915497_PDAC04_downscaled_hires', with elements:
        GSM8915497_PDAC04_hires_image (Images), GSM8915497_PDAC04 (Shapes)
    ▸ 'GSM8915497_PDAC04_downscaled_lowres', with elements:
        GSM8915497_PDAC04_lowres_image (Images), GSM8915497_PDAC04 (Shapes)
Join the tables into one AnnData#
to_anndata reads only the table of each member, not the images, and joins them. gene_key="symbol" puts every
member's genes under gene symbols first, so that sources which name genes differently share columns. obs["uid"] records which dataset each spot came from.
adata = cohort.to_anndata(gene_key="symbol")
print(adata)
adata.obs["uid"].value_counts()
AnnData object with n_obs × n_vars = 2221 × 36601
    obs: 'in_tissue', 'array_row', 'array_col', 'spot_id', 'region', 'uid', 'study_id'
    var: 'gene_ids', 'feature_types', 'genome', 'original_var_name'
    obsm: 'spatial'
    layers: 'csc_counts'
uid
qEP9pd4LlyKeufe20000    1142
URKDREjVhAsRwwF10000     660
Mc06lamGrOTYHhNF0000     419
Name: count, dtype: int64
norm = Normalize(vmin=0, vmax=np.log1p(adata[:, "COL1A1"].X.max()))  # one colour scale for all members
fig, axes = plt.subplots(1, len(cohort), figsize=(5 * len(cohort), 4.5))
for ax, ds in zip(axes, cohort, strict=True):
    member = ds.to_sdata()
    spots = next(iter(member.shapes))  # each member has one shapes element, its spots
    (
        member
        .pl.render_shapes(
            spots,
            color="COL1A1",
            table_name=ds.default_table,
            transfunc=np.log1p,
            norm=norm,
            colorbar=ax is axes[-1],
        )
        .pl.show(
            coordinate_systems=spots,
            ax=ax,
            frameon=False,
            title=f"{ds.uid}\n{member.tables[ds.default_table].n_obs} spots",
            colorbar_params={"label": "COL1A1, log(1 + counts)"},
        )
    )
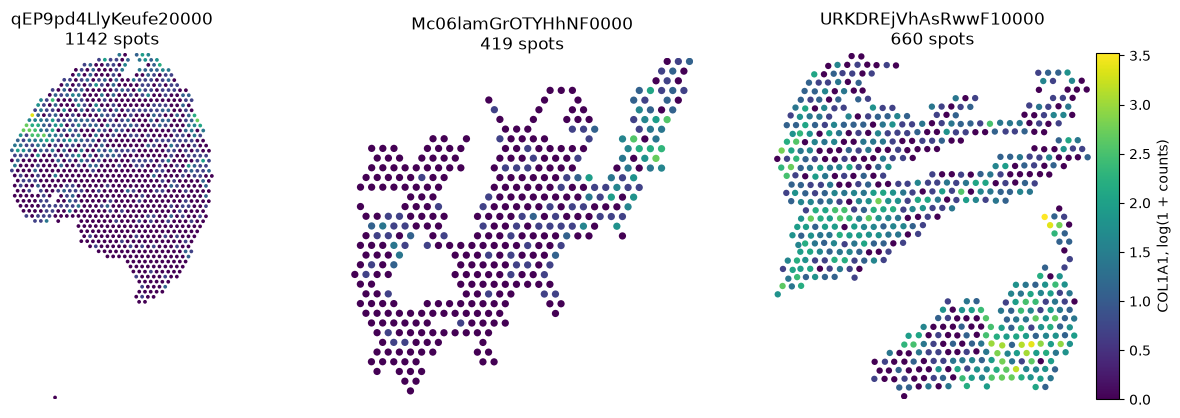
COL1A1 marks the fibrous stroma that surrounds pancreatic tumours. The figure loads each member with to_sdata()
and draws its spots with spatialdata-plot. The three sections share one colour scale (norm), so you can compare
them directly.
Freeze a manifest#
freeze() records the exact members, the catalog release and the sha256 of the catalog file. Write the manifest
next to your results. from_manifest rebuilds the same cohort later, and verify() checks that the catalog file
has not changed and every store still resolves.
manifest = cohort.freeze()
path = manifest.write(work / "pancreas.json")
restored = sddb.SpatialDataCohort.from_manifest(sddb.CohortManifest.load(path))
restored.verify()
print(manifest.hash)
print("same members:", list(restored.members["uid"]) == list(cohort.members["uid"]))
sha256:820413c42c5923d63d93683b40a2d3886636cae69481ba583222a3afead19b53
same members: True
Write the citations#
citations() writes one BibTeX entry per study. A study with an entry in the published bibliography gets that
entry, and any other study gets a fallback entry that cites its dataset page, with a warning that tells you to
check the fallback entries before you publish.
bib = cohort.citations(work / "pancreas.bib")
print(bib.read_text())
@article{geo:GSM8915497,
  title = {Spatial proteomics and transcriptomics reveal early immune cell organization in pancreatic intraepithelial neoplasia},
  volume = {10},
  ISSN = {2379-3708},
  url = {http://dx.doi.org/10.1172/jci.insight.191595},
  DOI = {10.1172/jci.insight.191595},
  number = {15},
  journal = {JCI Insight},
  publisher = {American Society for Clinical Investigation},
  author = {Lyman, Melissa R. and Mitchell, Jacob T. and Raghavan, Sidharth and Kagohara, Luciane T. and Huff, Amanda L. and Haldar, Saurav D. and Shin, Sarah M. and Guinn, Samantha and Barrett, Benjamin and Longway, Gabriella and Hernandez, Alexei and Coyne, Erin M. and Yuan, Xuan and Andaloori, Lalitya and Lai, Jiaying and Liu, Yun Zhou and Karchin, Rachel and Gupta, Anuj and Kiemen, Ashley L. and Forjaz, André and Wirtz, Denis and Wu, Pei-Hsun and Deshpande, Atul and Lee, Jae W. and Armstrong, Todd D. and Azad, Nilofer S. and Zimmerman, Jacquelyn W. and Wood, Laura D. and Anders, Robert A. and Thompson, Elizabeth D. and Jaffee, Elizabeth M. and Fertig, Elana J. and Ho, Won Jin and Zaidi, Neeha},
  year = {2025},
  month = June
}

@misc{geo:GSM8714178,
  title = {GSM8714178},
  howpublished = {\url{https://spatialdata-db-web.pages.dev/datasets/visium-spatial-gene-expression-pancreas-urkdrejvhasrwwf10000/}},
  year = {2025},
  note = {SpatialData-DB dataset URKDREjVhAsRwwF10000; license ncbi-geo-policy}
}

@misc{geo:GSM8714181,
  title = {GSM8714181},
  howpublished = {\url{https://spatialdata-db-web.pages.dev/datasets/visium-spatial-gene-expression-pancreas-mc06lamgrotyhhnf0000/}},
  year = {2025},
  note = {SpatialData-DB dataset Mc06lamGrOTYHhNF0000; license ncbi-geo-policy}
}
UserWarning: 1 of 3 studies have a published citation, in 1 entries after merging those that share a DOI; added 2 fallback entries that cite the dataset page; check them before publishing
Where to go next#
tutorial |
question |
|---|---|
which datasets match, and why does a search return more than I expected? |
|
what is in a store, and how do I load only what I need? |
|
how do I combine datasets, and get the same ones back next month? |
|
whom do I cite, and what may I do with the data? |
The use cases are longer analyses built on the same steps, and the API reference lists every class and function.